In sales, metrics are invaluable for guiding teams, driving performance, and ensuring that goals are met. Two primary types of metrics, leading indicators and lagging indicators, help businesses assess current performance and predict future outcomes. By understanding the difference between these metrics and how to leverage both effectively, you can optimize sales efforts, course-correct where needed, and improve forecasting accuracy. In this blog, we’ll dive into what leading and lagging indicators are, examples of each, and strategies for using them to drive sustainable sales growth.
What You’ll Learn
- The definitions and differences between leading and lagging indicators
- Examples of both types of indicators in a sales context
- How to use these metrics together to create a balanced approach to tracking sales performance and forecasting future results
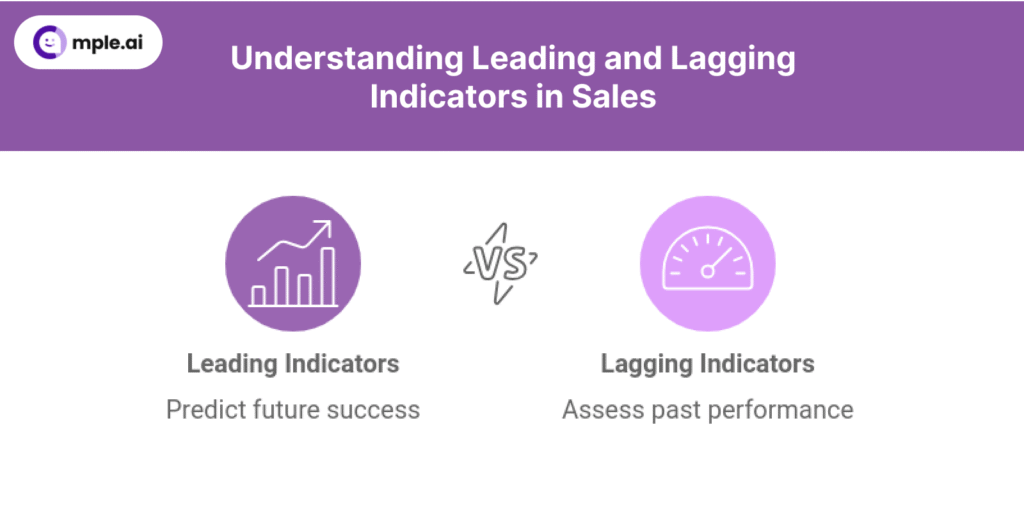
What Are Leading and Lagging Indicators?
Leading Indicators
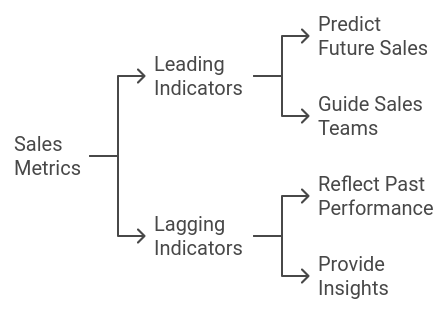
Leading Indicators are proactive metrics that provide insights into activities likely to drive future sales results. These metrics focus on actions that, if executed well, lead to goal attainment and revenue growth. By monitoring leading indicators, sales teams can assess whether they’re on track to meet targets and make adjustments early if needed.
Lagging Indicators
Lagging Indicators, on the other hand, measure the results of past actions. These are retrospective metrics that show outcomes after the fact, providing a clear view of performance but lacking the ability to influence future actions directly. While lagging indicators are critical for understanding what’s working, they don’t offer early warnings of potential issues.
Why Both Matter in Sales
While it’s easy to rely on lagging indicators to track performance, leading indicators are just as crucial for guiding sales efforts. Together, they offer a balanced view of sales health—leading indicators help predict outcomes, while lagging indicators confirm whether your strategies are working.
Examples of Leading Indicators in Sales
- 1. Number of New Leads Generated: The more leads generated, the greater the potential for conversions down the line. Tracking lead generation as a leading indicator allows teams to monitor the health of the sales pipeline and ensure they’re building a strong foundation for future sales.
- 2. Number of Outreach Attempts: This includes calls, emails, and meetings conducted. High outreach volume generally correlates with increased engagement and potential opportunities, making it a key leading metric.
- 3. Engagement Rate: Monitoring how often prospects respond to outreach efforts (e.g., email opens, call responses, social media engagement) can indicate interest and potential sales opportunities, giving teams a sense of which prospects are likely to convert.
- 4. Average Deal Stage Progression: Tracking how quickly prospects move through the sales funnel can indicate if the sales process is effectively designed to nurture leads. A consistent progression through deal stages signals a higher likelihood of conversion.
- 5. Sales Activity per Rep: The number of demos, pitches, or meetings a sales rep completes is a key leading indicator. Active engagement levels often signal how likely sales reps are to meet or exceed targets.
Examples of Lagging Indicators in Sales
- 1. Revenue Generated: This is the ultimate lagging indicator, showing the financial results of all prior sales efforts. Revenue is a critical outcome metric, but because it’s a lagging indicator, it’s useful for tracking past performance rather than predicting future sales.
- 2. Number of Deals Closed: Tracking closed deals reveals the effectiveness of the sales team’s efforts and offers insights into conversion rates. While valuable, it doesn’t provide advance warning of performance issues if fewer deals are expected in the pipeline.
- 3. Customer Retention Rate: Retention rate is an important indicator of customer satisfaction and loyalty. While it reflects the success of previous efforts, it’s a lagging measure that signals the need for improvements in customer engagement if retention rates are low.
- 4. Sales Cycle Length: Sales cycle length shows how long it takes to move prospects through the entire funnel, from initial contact to close. While valuable for tracking efficiency, it’s a retrospective measure that’s influenced by previous pipeline management efforts.
- 5. Quota Attainment: Quota attainment measures how well sales reps meet their targets. This metric confirms success but provides limited information on why targets were met or missed.
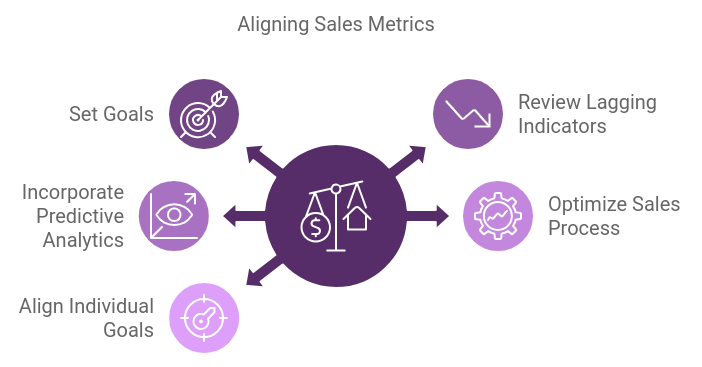
Using Leading and Lagging Indicators Together
- 1. Set Goals Using Leading Indicators: Establish clear targets based on leading indicators (e.g., weekly outreach goals, monthly lead generation numbers). These short-term, activity-focused goals ensure your team’s actions align with long-term revenue objectives.
- 2. Regularly Review Lagging Indicators to Adjust Strategy: Use lagging indicators like revenue and closed deals to evaluate overall performance. If these metrics fall short of expectations, analyze the related leading indicators to determine which activities need adjustment.
- 3. Incorporate Predictive Analytics: Use sales forecasting tools to analyze leading indicators and predict future performance. Predictive analytics can offer insights into whether your current activities are likely to lead to quota attainment, helping you make proactive adjustments.
- 4. Optimize Your Sales Process Based on Outcomes: Analyze lagging indicators like sales cycle length and closed deals to find bottlenecks. Use this data to optimize the sales process and enhance leading indicators, ensuring that future efforts drive faster conversions and increased revenue.
- 5. Align Individual and Team Goals: Break down leading indicator targets to an individual level to ensure each team member contributes to overall goals. For example, setting call targets for individual reps helps everyone work towards team quotas and revenue objectives.
Common Mistakes to Avoid When Using Sales Indicators
- 1. Relying Solely on Lagging Indicators: Lagging indicators show outcomes but not the contributing activities. If a team only tracks lagging metrics, they may miss opportunities to correct course in real time. Balance with leading indicators to stay proactive.
- 2. Setting Unrealistic Leading Indicator Targets: Leading indicators should be challenging but achievable. Setting unrealistic activity goals can lead to burnout without significantly impacting outcomes. Ensure that targets align with available resources and team capacity.
- 3. Not Adapting Based on Data: Tracking metrics without adapting strategies is a missed opportunity. If leading indicators suggest a potential issue (e.g., fewer leads generated), adjust outreach efforts rather than waiting for lagging metrics to confirm a shortfall.
Key Takeaways
- • Leading Indicators Drive Action: Leading indicators focus on actionable metrics that give insight into potential future outcomes.
- • Lagging Indicators Confirm Results: Lagging indicators provide retrospective analysis, showing whether your actions successfully led to desired outcomes.
- • Use Both for a Balanced Approach: Leading and lagging indicators are most powerful when used together, enabling teams to act proactively and validate success.
- • Review and Adjust Regularly: Regularly reviewing both types of indicators helps teams course-correct and stay aligned with sales goals.
Conclusion
Understanding the distinction between leading and lagging indicators in sales is essential for building a robust strategy that combines real-time action with long-term tracking. Leading indicators allow sales teams to anticipate and prepare for upcoming challenges, while lagging indicators provide the concrete results necessary to refine and validate strategies. By integrating both types of metrics, sales leaders can guide their teams to reach targets, drive growth, and improve performance predictively rather than reactively.
FAQs
- 1. What are some examples of leading and lagging indicators outside of sales? In marketing, website traffic and social media engagement are leading indicators, while conversion rates and customer acquisition costs are lagging indicators.
- 2. Can leading indicators guarantee future success? While leading indicators provide insights and early signals, they cannot guarantee outcomes. They help guide actions that contribute to desired results, but external factors can still impact success.
- 3. How often should sales teams review these metrics? Weekly reviews of leading indicators and monthly or quarterly reviews of lagging indicators are common. This frequency allows for proactive adjustments without overwhelming the team.
- 4. What if my team is consistently hitting leading indicator targets but missing revenue goals? Evaluate whether the leading activities are truly aligned with revenue-generating outcomes. If there’s a gap, adjust the focus on leading indicators or refine the sales process to improve alignment.
- 5. Should small businesses use leading and lagging indicators, or are they only for large teams? Both small and large sales teams benefit from tracking leading and lagging indicators. For small businesses, these metrics can offer structure, provide focus, and drive data-driven growth decisions.